top of page
.png)
In this report, I demonstrate my understanding of:
-
Measures of central tendencies and dispersion
-
Kurtosis and Skewness
-
Tolerance Limits
-
Process Capability, both Cp and Cpk
Week 2
Grouped Data Analysis
.png)
In this report, we determine the process capability using grouped data analysis and statistical process control then followed by sufficient discussion and analysis.
Week 3
Statistical Process Control
.png)
This report demonstrates my understanding of process capability, differences between grouped data and data taken over time, and the advantages of each.
Week 4
Quality Engineering Report I
.png)
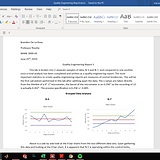
This report shows an analysis and sufficient discussion of probability distribution as well as differentiating the use of control charts for variables vs. attributes, typical uses of each, as well as the distributions used for each.
Week 5-6
Quality Engineering Report II
bottom of page